I was inspired by “Prime Number Pattern P Mod 40” by Jason Padgett. Padgett was mugged in 2002, sustaining a head injury that caused “a form of synesthesia and savant syndrome”. Jason sees visions of geometrical and mathematical forms and illustrates them. Here’s a video about him.
As a fan of prime numbers myself and having been teaching them to my son, I decided to replicate his prime number drawings in code.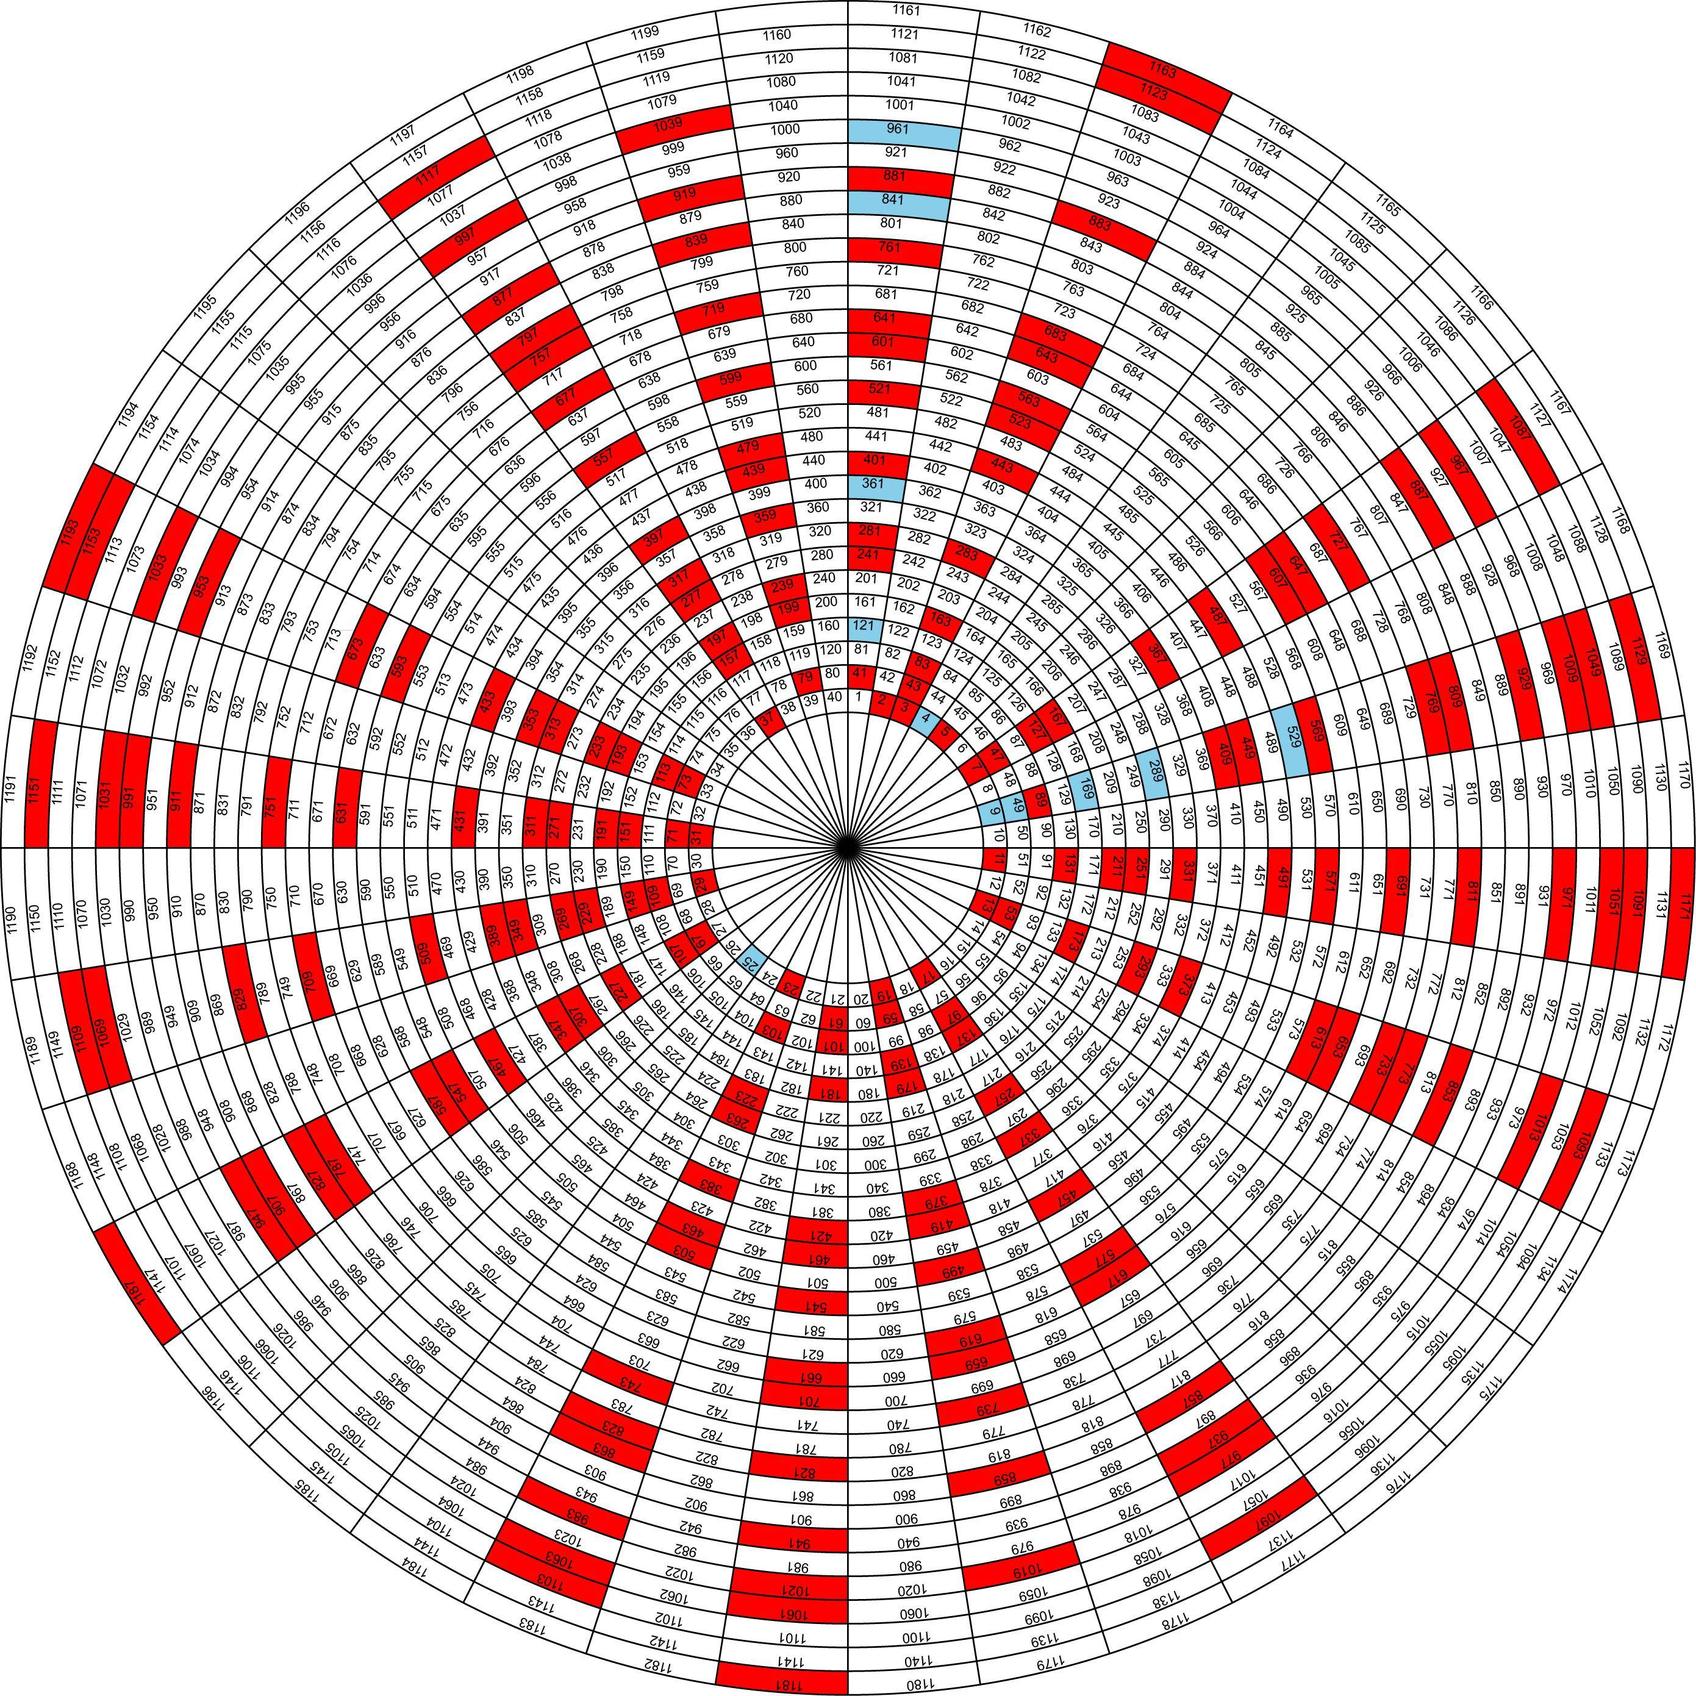
I’ve written output before in GraphViz, Adobe Illustrator and other structured graphic data representations. Postscript is a common flavor for structured graphical output as well, but I struggled with Adobe syntax when writing Illustrator files, and I didn’t wish to go down that path (heh, pun!) again. The obvious choice as an output format was SVG, a modern, XML-based format with a fairly simple syntax. Most browsers can display SVG, and Adobe products can load it and display or convert it to other graphical formats.
Once again, I could have written this program in C/C++ pretty easily, but in the interest of learning and in sharing the experience and code with others, I chose Python as my language. Since the actual generation of the primes is not my focus, I sourced a sieve code fragment fromhttp://code.activestate.com/recipes/535154/. Similarly, I didn’t feel like engineering a 2D rotate function from scratch in Python, so I grabbed one fromhttp://ubuntuforums.org/archive/index.php/t-975315.html.
The script begins with a number of configurable variables:
width = 1000

height = width

maxrings = 30

modulo = 40 #cannot be zero

centermarginsize = width * .08

showdigits = True

showrings = True

showradials = True

showprimefill = True;

showprimesquares = True

backgroundcolor = "none"

nonprimetextcolor = "black"

primetextcolor = "black"

primefillcolor = "red"

primesquarefillcolor = "skyblue"
Width and height control the drawing space size (I set width to height since it’s round). Maxrings defines how many rings there are from the center outward. Modulo is, in Padgett’s terminology, the number of radial segments on each ring. Don’t make it zero or things will crash. Centermarginsize is how big the ringless-center area is. Showdigits, showrings, showradial, showprimefill and showprimesquares control the visibility of certain graphical features and are pretty obvious with some experimentation. Backgroundcolor nonprimetextcolor, primetextcolor, primefillcolor and primesquarefillcolor all define the colors of various items and are also self-obvious.
The next block pre-computes a number of runtime-constant values. Next is a set of small utility functions to compute the row and column in the chart for a given number, the rotation that that cell is at, and XY coordinates for the cell.
The highlightbox() function is a wrapper to emit a filled block for a given cell. This could use a little tweaking. It uses SVG’s arc feature, which is a little quirky to figure out for me. I think it’s almost right, but there’s a radius wrong somewhere.
Finally at around line 144, we open the output file and start by writing an SVG header. Change the path here to suit your own system.
On line 149 we generate the table of primes, and then expand that into a truth table of primality for all integers up to maxnums (which is maxrings * modulo). We also write a truth table for the numbers that are squares of prime numbers, in case we’re configured to highlight those. This could probably be done more efficiently (we generate maxnums primes, but really we want fewer primes than that — simple all primes UP TO maxnums).
Line 162 writes out the SVG tag defining the document. I invoke the xlink namespace here in case we want to use text-on-a-path later (which I tried at one point but had trouble with). Line 163 writes out a document-filling solid colored rectangle in case you want a color scheme with a non-white background. Line 165 defines a G element that applies a style to all sub-elements within it. Here I define the font size. It probably should be a config setting at the top. Several styles didn’t seem to stick properly when defined here, so I ended up applying them individually to each element.
Now we iterate all the numbers up to maxnums (starting at 1, because 0 isn’t interesting). we get the coordinates and rotation of the cell for this number. Then, from the cell corners, we compute a text baseline position. Next we figure out what the colors should be for the fill and text. we write the fill highlight, and then colored text. The commented out lines on 190-191 were an attempt to use text-on-a-path. THis actually worked, but i couldn’t make the PATH itself not render. Onscreen it looked fine, but printing in Chrome (and always in Illustrator) the path the text was intended to follow was showing up. I ended up just fighting with the transform argument with the rotate command to slap the text into the right orientation. If you figure out what I did wrong, please let me know.
 Finally, the code at lines 198 and 203 blast out the radial and concentric linework ensuring it is on top of the other elements. All that’s left is to write the closing SVG tag and close the file.
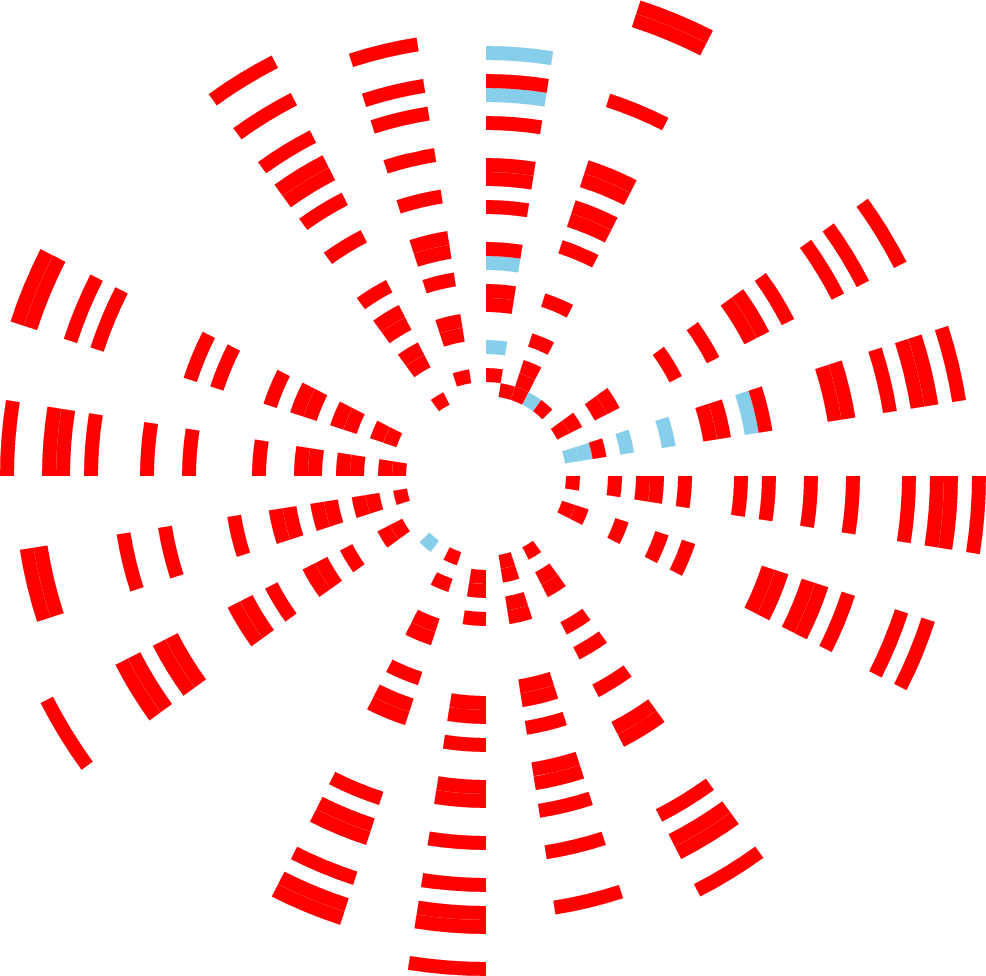
Another variant of the same diagram from a different website has a black background, with no fills or linework, but simply colors primes and non-primes with different text colors, on a modulo 25 layout. This is easily achieved by changing the variables at the top of the file. Here is a version with only the colored highlights, no linework or numbers.
Let’s look at the modulo 40 layout. You’ll notice that the primes all fall on several radials, and avoid others. This is easily explained. Every other radial represents an even number, and no even numbers past 2 are prime. Similarly, every fifth radial represent multiples 5, preventing primes along the length of its vector. Two, and Five are the positive, prime, integer factors of our modulo, 40 (the full set of factors is 1, 2, 4, 5, 8, 10, 20, 40). There seems to be no magic to this, and no human-perceivable pattern to the distribution of primes within the prime-permitting radial vectors.
However, I’ve saved the best for last. There is one last, mind-blowing mystery revealed by this chart. Outside of the first, inner ring, ALL of the prime squares (numbers that are a prime number squared) ALL fall into two columns — the first and ninth. I can see absolutely no reason for this pattern, but if anyone else can explain it, I’m all ears.
I am interested in two further explorations. First, I’d like to continue this chart bigger. Second, I’m interested in animating this chart as Modulo goes from 2 up to larger numbers. In these application, the display of the actual numbers is probably not necessary, we’re interested in the patterns formed by the vectors of primality (hey, that sounds like the name of a techno band from the 80s). These applications
Bugs: I am aware of a radius problem with the highlightbox fill. It’s nominal with larger Modulo values (you can see it as slivers of white between the fill and the cell border) but with lower modulo values it becomes prominent. Also, I’ve seen fencepost errors in drawing the radials. If anyone wants to make corrections to the code, please send me fixes, or I’ll update them if I debug it myself when I have time.
The SVG file and Python script (renamed with a .txt extension) are attached below. Both can be used under CC BY-NC-SA 2.5.
